Support
Contact is by email at hello@chat2invest.com, with a Twitter account also listed on the homepage. No help centre or documentation portal is published.
Reproducible ETF strategy research that publishes the failures

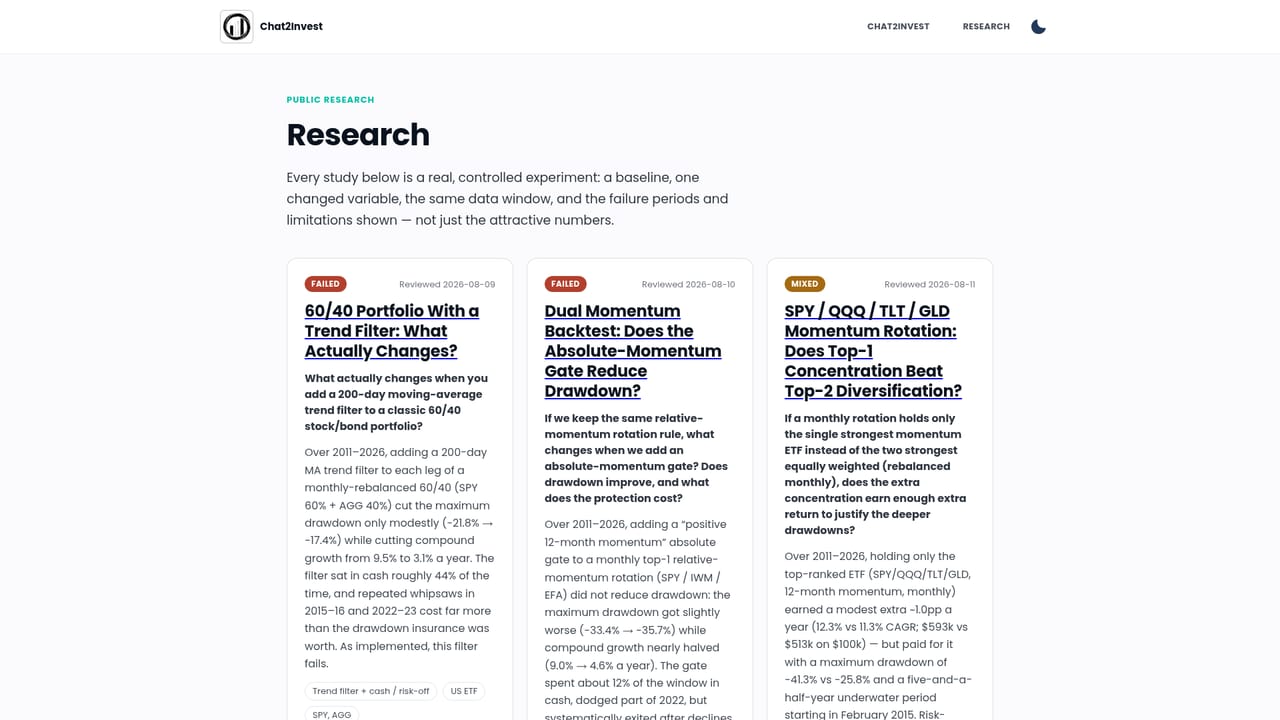
Chat2Invest publishes reproducible research on low-frequency ETF and portfolio strategies. Each study starts from a simple baseline, changes one variable, runs both sides on the same data window, and reports costs, cash exposure, drawdowns and failure periods. It is a research product, not a stock picker or trading bot.
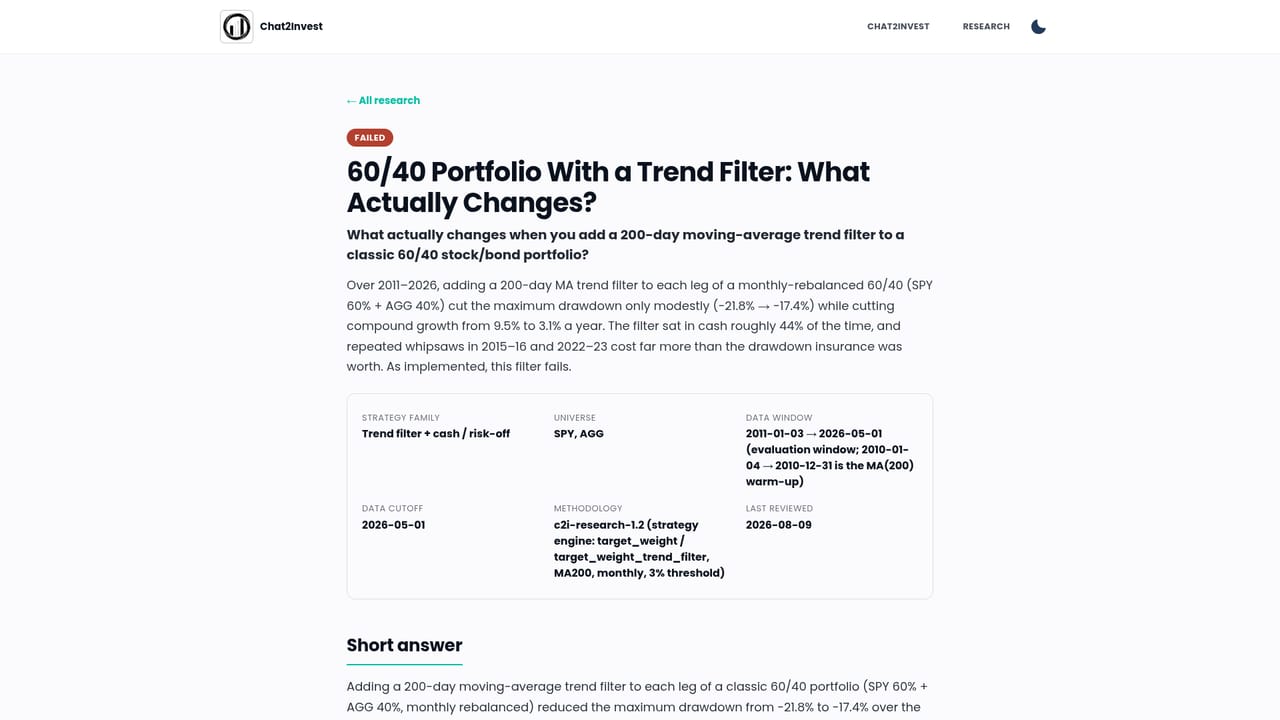
Chat2Invest is a research publication rather than an investing tool. It produces studies of low-frequency ETF and portfolio strategies, and each study is written so that a reader can rerun the logic: the baseline, the one variable that changed, the data window, the cost assumptions and the results all appear in the open. The site is explicit that it is not a stock picker and not a trading bot, and there are no buy or sell recommendations anywhere in the output. The method is consistent across studies. A study opens with a plain, widely known starting point instead of an exotic configuration tuned to look impressive. One important input then changes (a trend filter, a lookback length, a rebalance frequency, a fallback asset) while the other side of the comparison runs on identical dates, symbols and assumptions, so any difference can be traced to the change. Fees, turnover and the share of time held in cash are reported alongside returns, and drawdowns, the worst year and whipsaw periods are presented as prominently as compound growth. The published 60/40 trend filter study shows how this plays out. Over 2011 to 2026, adding a 200-day moving average filter to each leg of a monthly-rebalanced SPY/AGG portfolio reduced maximum drawdown from -21.8% to -17.4% but cut compound growth from 9.5% to 3.1% a year, with cash exposure averaging 43.8% and turnover above 100%. Chat2Invest labels it a failure as implemented. That outcome is treated as a legitimate result, and failed or inconclusive studies are published rather than buried. The audience is self-directed investors who already understand backtesting and want to see where a rule breaks before committing capital, plus analysts who value disclosed limitations over polished equity curves. Anyone looking for daily signals, personalized portfolio advice or parameter optimization will not find it here. The research index is open without sign-up, and the catalogue is deliberately small: the site argues one thorough study beats ten shallow ones, with more in review.
Contact is by email at hello@chat2invest.com, with a Twitter account also listed on the homepage. No help centre or documentation portal is published.
Studies follow a fixed template: a simple baseline, one changed variable, an identical data window on both sides, published costs and cash exposure, drawdowns and whipsaw periods, and a limitations section. Failed and inconclusive studies are published too. The site states there are no stock picks, no personalized advice and no best-parameter optimization.
 AI Angels400+ customizable AI girlfriends for NSFW chat, voice calls, and roleplay
 Candy AIExperience the future of companionship with AI friends who chat, role-play, and connect with you on a human level.
 ourdream.aiA vast AI roleplay platform with millions of characters for chat, images, video and voiceAI Angels400+ customizable AI girlfriends for NSFW chat, voice calls, and roleplayCandy AIExperience the future of companionship with AI friends who chat, role-play, and connect with you on a human level.ourdream.aiA vast AI roleplay platform with millions of characters for chat, images, video and voice


