Free trial
Signing in gives 60 free credits to generate infographics. The homepage does not state an expiry or a time limited trial.
Learn moreTurn text, data or long notes into 4K infographics and charts
Own Infograph.app? Verify ownership to get a dofollow link

Infograph.app is a content generation tool that turns text, data or long notes into 4K infographics and charts. Infograph.app is a web-based AI generator that turns prompts, pasted text or raw data into 4K infographics, charts and diagrams, with a template gallery of reusable prompts for education, business, healthcare and research.
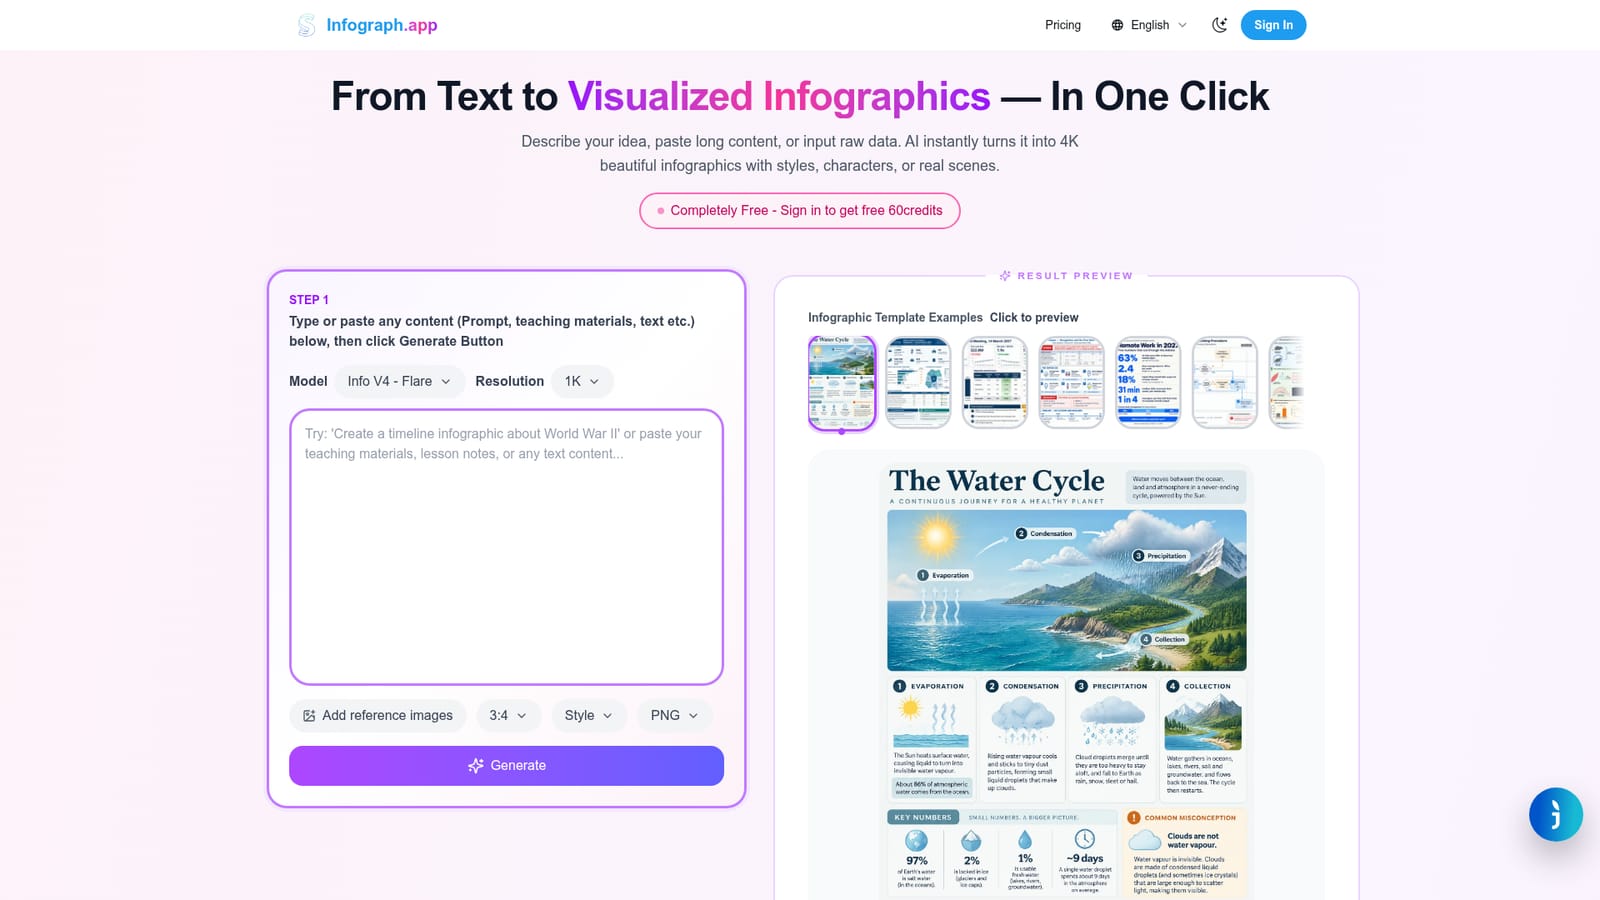
Infograph.app is a browser-based generator that converts written content into finished infographics. A user types a short idea, pastes long teaching material, or drops in raw data, and the AI lays it out as a visual with titles, panels, charts and illustration. The site says output can reach 4K and that it supports more than 300 chart types, including timelines, flowcharts, concept maps, mind maps, Venn diagrams and comparison charts. The workflow is a single form on the homepage. The user enters the content, picks a model (the default shown is Info V4 - Flare), sets a resolution and aspect ratio (3:4 is the default shown), chooses a style, optionally adds reference images, and presses Generate. A result preview appears alongside. Because the generator is prompt driven, the quality of the layout depends heavily on how specific the instructions are, and the homepage demonstrates this with long, structured prompts that spell out panels, palettes and typography. A large template gallery doubles as a prompt library. Examples are grouped into Education, Government & NGO, Business & Reporting, Healthcare, Social & Marketing, Research and Technical, covering items such as a water cycle teaching card, an annual results report, a board pack summary, a clinical protocol card, a social stat card, an organisation chart and a system architecture diagram. Each one can be previewed, its prompt copied, or used to generate a similar infographic. Some examples are in Spanish and Arabic, which suggests multilingual output. The target audience is students, teachers, marketers, researchers and creators who need clear visuals quickly. Compared with manual design tools such as Canva or Figma, it trades fine control for speed: the layout is generated, not dragged together. Compared with general image generators, it is aimed at text-heavy, data-dense pages. The homepage describes the service as free, with 60 credits granted on sign-in, and a separate pricing page exists for paid options.
Signing in gives 60 free credits to generate infographics. The homepage does not state an expiry or a time limited trial.
Learn moreThe homepage describes the tool as completely free and says signing in grants 60 free credits. A separate pricing page lists plan details, which the homepage does not spell out.
Learn moreText-to-infographic generation, raw data visualization, 4K output, 300+ chart types (timelines, flowcharts, mind maps, Venn diagrams), selectable model, resolution, aspect ratio and style, reference images, and a categorized template and prompt gallery.


