Pricing
The homepage points users to a free signup via a "Get Napkin Free" call to action but does not list specific plans, prices, or usage limits.
Learn moreTurns pasted text into editable infographics, diagrams, and charts in seconds.
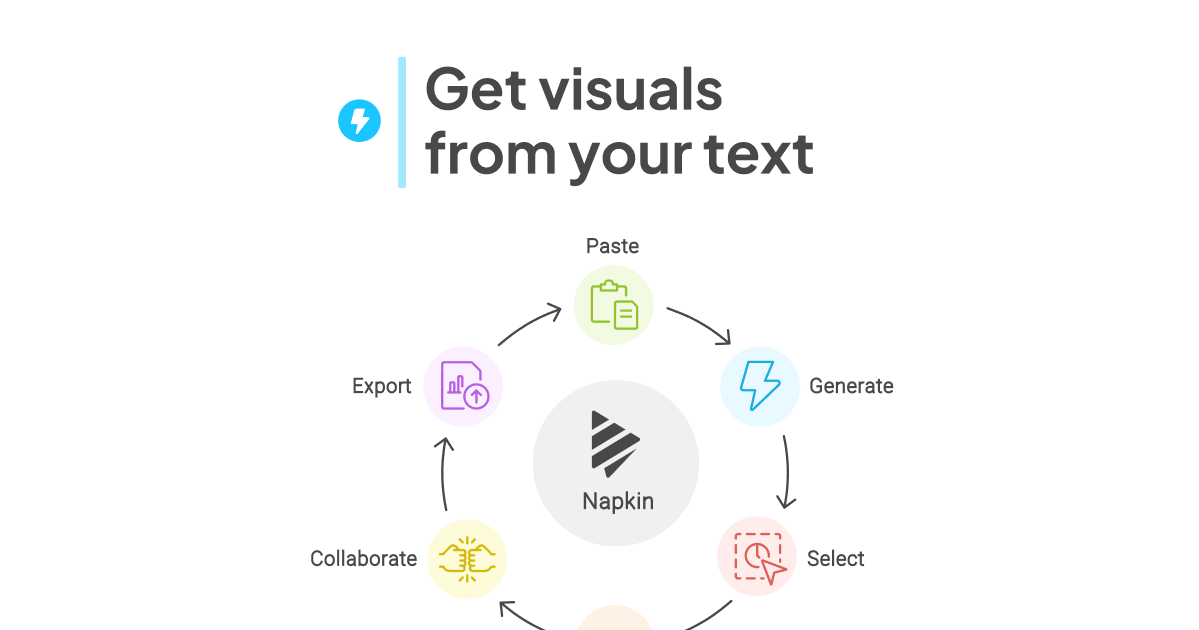
Napkin is a design tool that turns pasted text into editable infographics, diagrams, and charts in seconds. Napkin converts pasted or imported text into editable infographics, diagrams, flowcharts, and data charts, letting users pick a generated visual, restyle colors and layout, and export it as PPT, PNG, PDF, or SVG for slides, docs, blogs, or social posts.
Napkin is a visual-generation tool built for business storytelling. Instead of starting from a blank canvas or a prompt, users paste or import existing text, such as a report, a script, or a set of notes, and Napkin analyzes it to produce a set of candidate visuals: infographics, diagrams, mind maps, flowcharts, and data charts that represent the same information graphically. The user picks whichever version best matches their intent and refines it from there. The core idea is removing the prompting step that most AI image and design tools require. Because Napkin works directly from text a person has already written, it fits naturally into workflows where the writing comes first and the visual is meant to support or replace a wall of text: a blog post that needs a diagram, a deck that needs a flowchart, a LinkedIn post that needs a shareable graphic. Once a visual is generated, nothing about it is locked: colors can be changed to match a brand palette, individual elements can be pulled apart and repositioned, and the whole piece can be restyled without regenerating from scratch. Finished visuals export as PPT, PNG, PDF, or SVG, so they can be dropped into PowerPoint, Google Slides, Canva, Keynote, Google Docs, Word, Notion, Confluence, or published directly to blogs and social platforms. Napkin is aimed at people who communicate ideas for a living but do not have design training or time for one: marketers, founders, consultants, educators, and content teams turning dense text into something scannable. It sits in a different niche than general-purpose design tools like Canva or diagramming apps like Lucidchart, since rather than building a visual from shapes and templates, Napkin's entry point is prose, making it better suited to converting existing written content than to open-ended creative design work. Within the broader landscape of AI chart and diagram generators, Napkin's distinguishing trait is that it treats text as the primary input rather than a prompt, and it emphasizes fast, editable output over highly customized initial design control.
The homepage points users to a free signup via a "Get Napkin Free" call to action but does not list specific plans, prices, or usage limits.
Learn moreNo direct software integrations are stated; the homepage instead highlights export compatibility with PowerPoint, Google Slides, Canva, Keynote, Google Docs, Word, Notion, Confluence, and platforms like Medium, Substack, WordPress, LinkedIn, X, Instagram, and YouTube.
Generates infographics, diagrams, mind maps, flowcharts, and data charts directly from pasted or imported text; outputs are fully editable (colors, individual elements) and export as PPT, PNG, PDF, or SVG.